
 Smart Agent Teams
Dashboard
The company at a glance: what is happening, what needs you, and what it costs.
The dashboard is the first screen after you sign in. It answers three questions in one place: what your agents are doing right now, whether anything needs a decision from you, and how this month's spend compares with the company budget. It is built from one API call, GET /dashboard, which the web app, sat dashboard and sat watch all use.
How it works
- Agents counts exclude
terminatedagents. - Tasks by status counts every task, including
doneandcancelled. Tasks by priority counts only open tasks (notdoneorcancelled). - Spend is month-to-date: the sum of run
cost_centssince the 1st of the current UTC month, against the company'smonthly_budget_cents(0means no limit). See Budgets and costs. - Active runs are up to 20 runs that are
queuedorrunning, newest first. - Series has one point per UTC day for the last
daysdays (7, 14 or 30; default 14), counting succeeded and failed runs and run cost by the day the run was created, and tasks by the day they were created and completed. - For you covers the signed-in member's own work: open tasks they created, how many of those are
blocked, and the five most recently updated.
The dashboard is computed on every request; nothing is cached on the server.
Fields
Dashboard:
Prop
Type
Use it
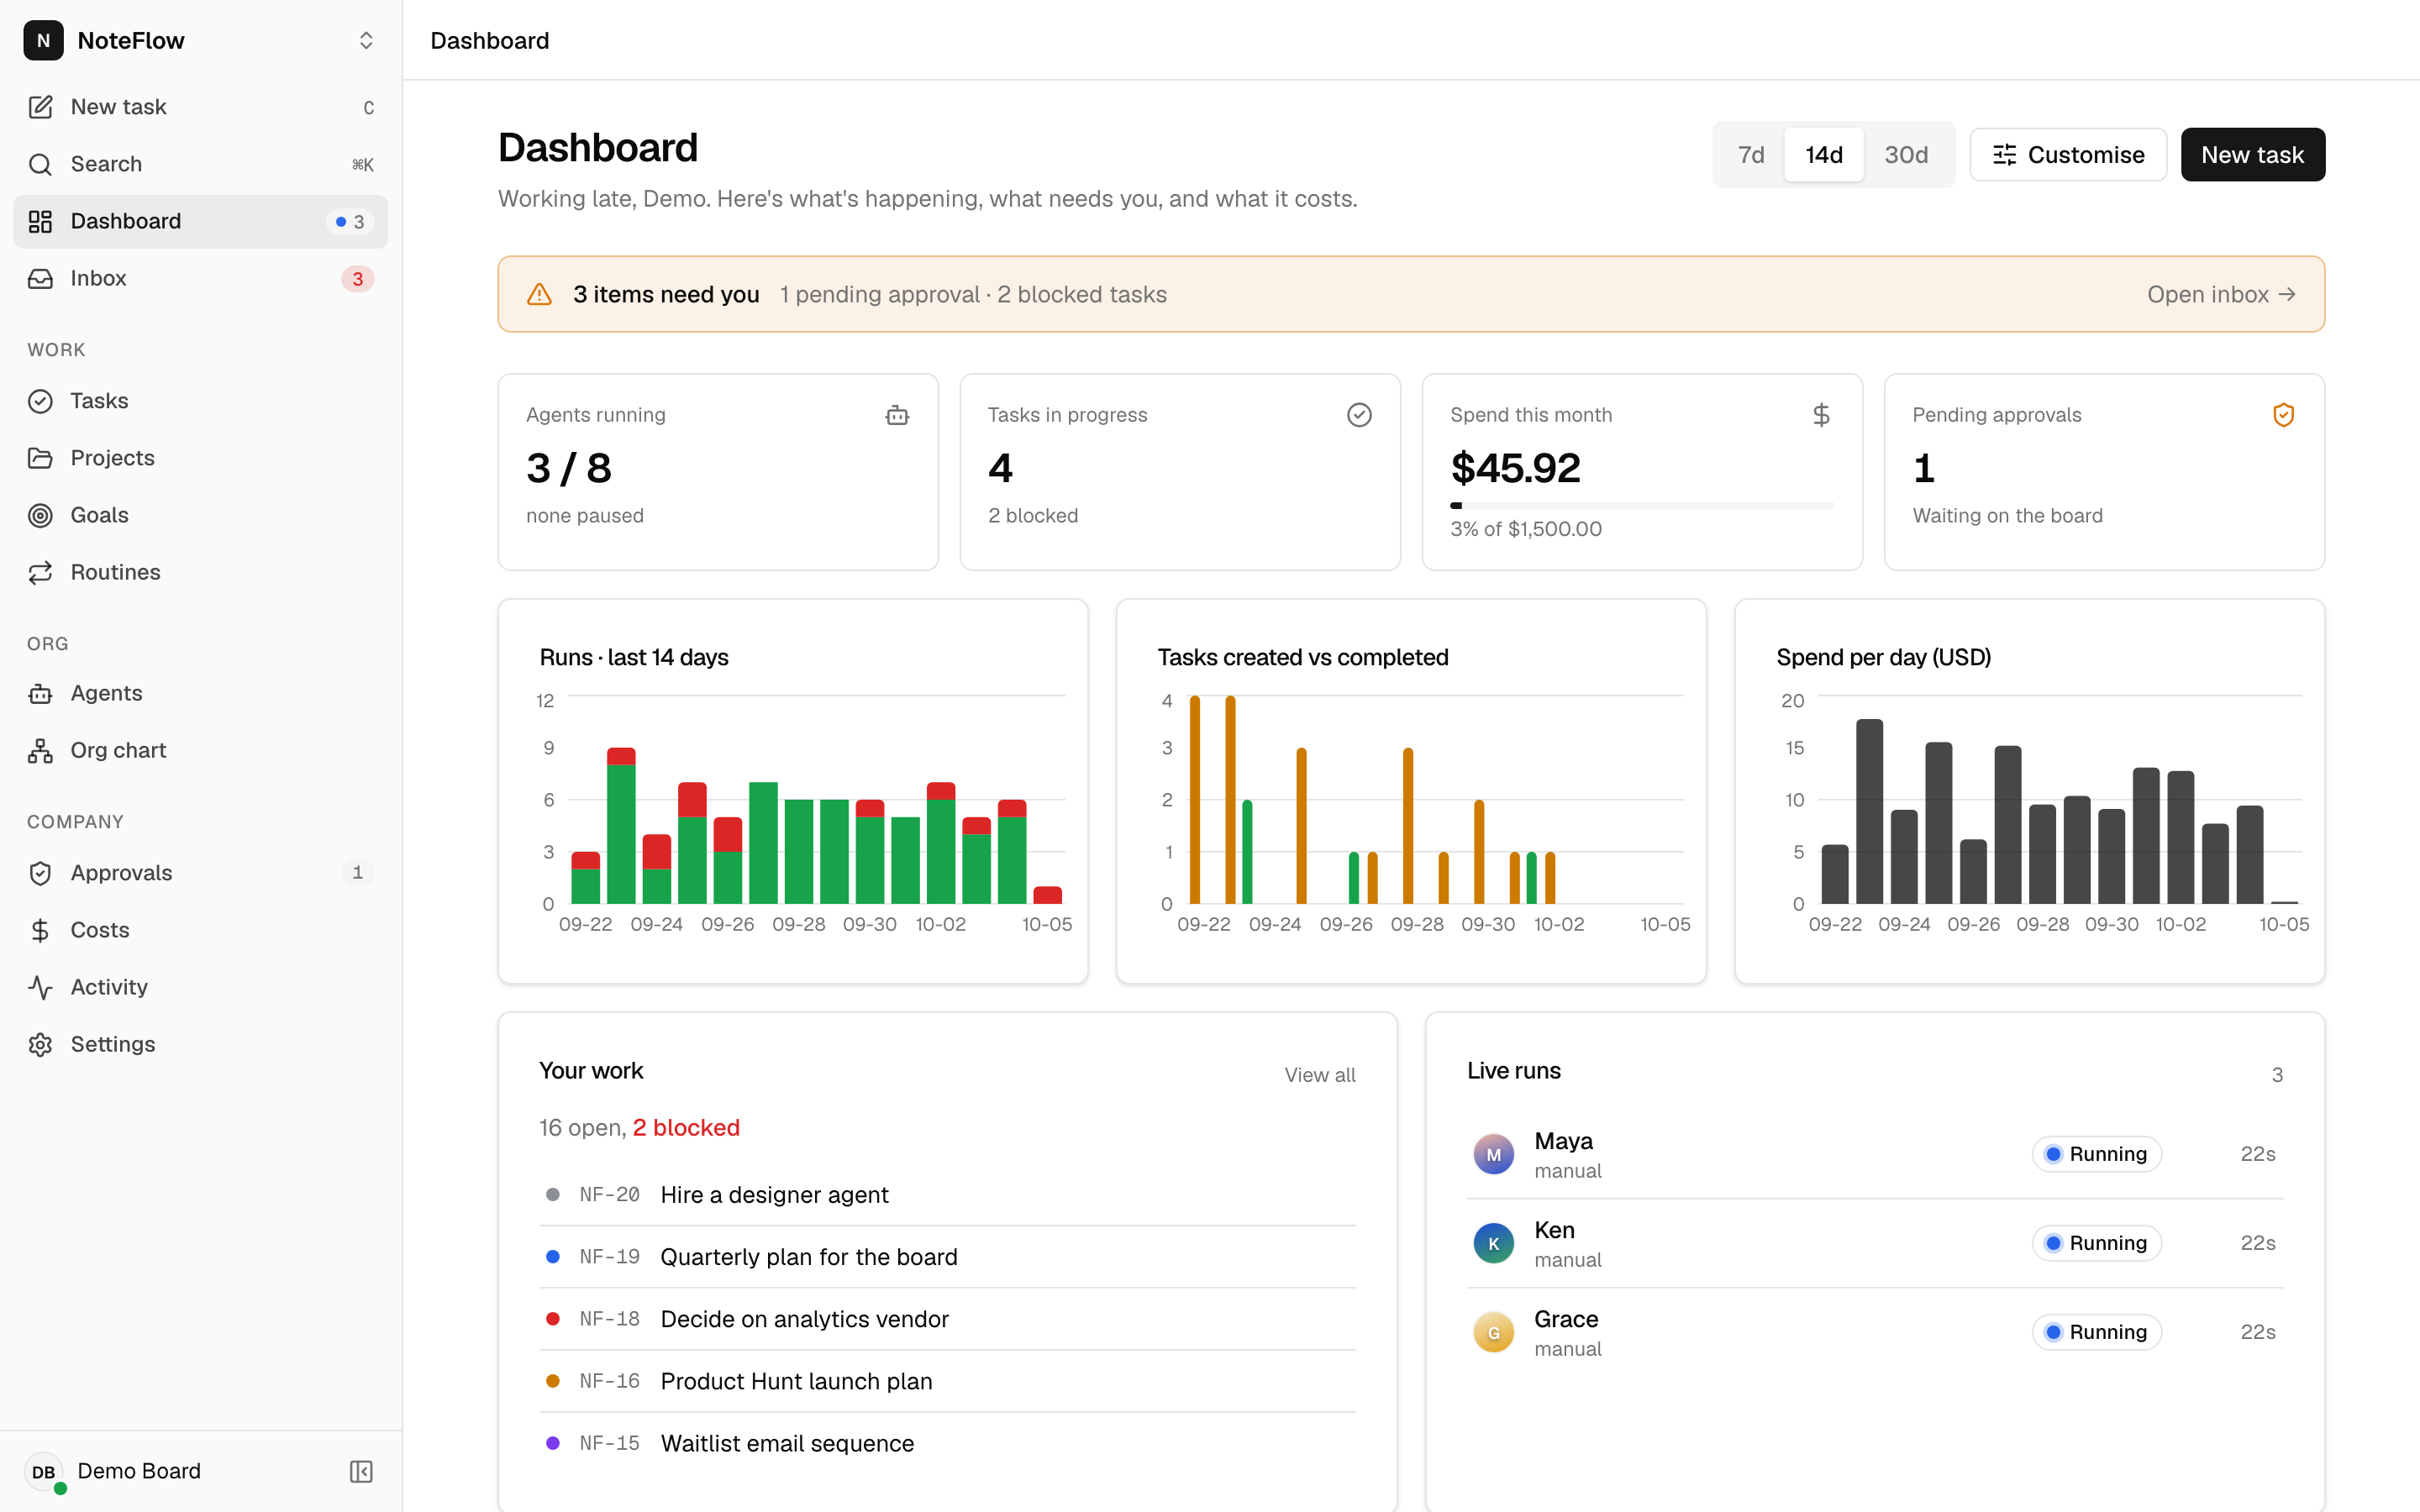
The page greets you by first name in your time zone ("Good morning, Siri") and shows these cards:
| Card | Shows | Selecting it opens |
|---|---|---|
| Key numbers | Agents running out of total (and how many paused), tasks in progress (and blocked), Spend this month with a bar against the company budget or "No company budget", and pending approvals. | Agents, Tasks, Costs, Approvals |
| Trends | Three bar charts over the selected range: runs succeeded and failed, tasks created and completed, and spend per day in US dollars. | |
| Your work | Open tasks you created, with the blocked count and the five most recent. View all opens Tasks filtered to "Created by me". | The task |
| Live runs | Queued and running runs with agent, trigger, status and elapsed time. | The run |
| Tasks by status | A bar per board column (backlog to done; cancelled is not shown). | Tasks filtered by that status |
| Recent activity | The latest 12 activity log entries. View all opens Activity. | The entity |
Above the cards, a banner appears when pending approvals plus blocked tasks is more than zero, for example "3 items need you · 1 pending approval · 2 blocked tasks", and links to the inbox.
Header actions:
- 7d / 14d / 30d sets the chart range.
- Customise opens a sheet where you drag cards into a new order and switch cards off. Reset layout restores the default.
- New task opens the new task dialog.
The range, order and hidden cards are saved to your account (preferences.dashboard), so they follow you to every device. The page refreshes itself from live updates. On phones the cards stack in one column; see dashboard-mobile.png in the web app tour.
Permissions
Any member can read the dashboard. for_you is computed for the caller. Non-members get 404 NOT_FOUND.
Events
The dashboard has no events of its own. The web app refreshes it on task.*, agent.*, run.* and approval.* events.
Limits and known gaps
- Days and months are UTC. Your time zone preference changes how dates are shown, not which day a run is counted in.
active_runsis capped at 20.- The web app does not display
tasks_by_priority. for_youonly covers tasks you created. There is no notion of tasks assigned to a person.- The "items need you" count is pending approvals plus
blockedtasks; the inbox page also listsin_reviewtasks and failed runs.